
29 August 2026

Calculate Raffle Odds for UK Draws: Live Odds Updated Every 10 Minutes
Your odds of winning a single prize are simply your tickets divided by total tickets sold, expressed as a percentage or “1 in X”. For multiple prizes, use the complement rule: probability of winning at least once equals 1 minus the probability of winning nothing at all. Skip to the calculator guidance below to plug in your own numbers and get an instant answer.
TL;DR:
- Raffle odds depend on the total tickets, your tickets held, and the number of prizes, with exact calculations using hypergeometric formulas for precision.
- The probability of winning at least one prize is 1 minus the probability of winning nothing, with different formulas for with and without replacement draws.
- Expectation value can determine if a raffle is financially favorable, calculated by multiplying prize value by win probability and subtracting ticket cost.
- Common mistakes include misinterpreting expected number of wins as probability and ignoring whether draws are with or without replacement.
- Live odds tracking and real-time ticket sales updates improve accuracy, helping you identify undervalued raffles before entering.
Table of Contents
- How to use a raffle odds calculator
- The maths behind raffle odds: hypergeometric formula and the complement rule
- Worked numerical examples and edge cases
- Is a raffle worth the ticket price? The expected value test
- Common calculation mistakes and practical tips
- How to reproduce raffle odds in Excel or Google Sheets
- Why live totals matter: how Raffle Genius uses real-time tracking to refine odds
- Quick rules of thumb for entering raffles
- Track live odds before you spend another penny
- Sources
How to use a raffle odds calculator
Every raffle odds calculator asks for the same three core inputs, whatever the interface looks like. Get these right and the output takes care of itself.
- N (total tickets): the full size of the ticket pool, whether that’s 500 or 50,000.
- k (your tickets): how many entries you personally hold.
- n (number of winners): how many prizes will be drawn from that pool.
The calculator also needs to know the drawing method. Most raffles draw without replacement, meaning a winning ticket is removed from the pool before the next draw, so nobody wins twice with the same entry. Some giveaways, particularly those with independent random draws for each prize, work with replacement, where every ticket stays eligible for every prize.
Optional fields sharpen the picture further. Ticket price and prize value let the tool calculate expected value, while some calculators also show your expected number of wins across all prizes. The output typically gives you three figures: win probability as a percentage, odds phrased as “1 in X”, and expected value in pounds. Together, those three numbers answer the only question that matters: is this raffle worth entering?
The maths behind raffle odds: hypergeometric formula and the complement rule
Raffles with multiple prizes and no replacement follow the hypergeometric distribution. The formula for winning at least one prize is:
P(at least one) = 1 − C(N−k, n) / C(N, n)
Here, C(a,b) means “a choose b”, the number of ways to select b items from a items without caring about order. C(N−k, n) counts the draws where none of your tickets get picked; C(N, n) counts every possible draw outcome. Subtract the fraction from 1 and you get the probability of winning something.
When a raffle draws with replacement, a simpler approximation works: P(at least one) = 1 − (1 − k/N)^n. This is close enough for most casual estimates, particularly when k is small relative to N, but it starts drifting from the exact answer as ticket share or prize count grows.
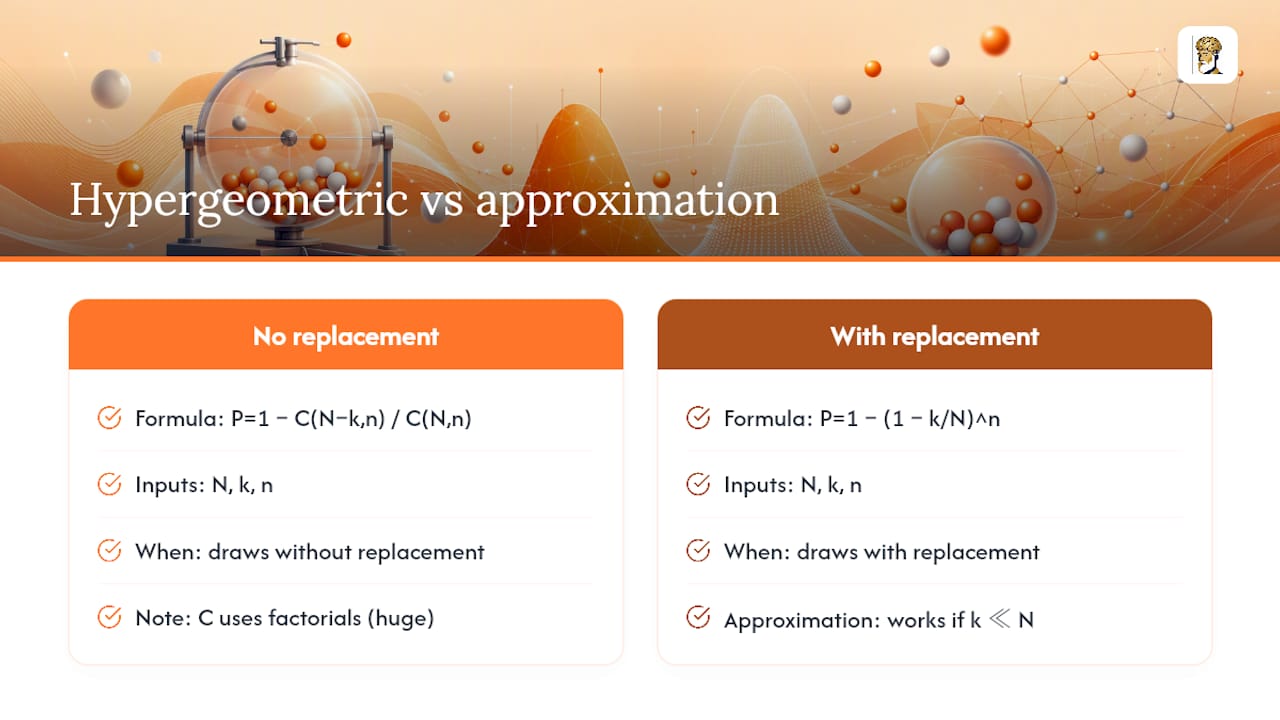
There’s a practical reason serious calculators avoid naive arithmetic on large pools. Factorials in the combinatorial formula explode quickly. A raffle with 50,000 tickets produces numbers no standard calculator can handle directly, so production tools use logarithmic or expm1 techniques to avoid floating-point underflow. The result is rounded only at the final step, which is why two calculators can occasionally disagree by tiny fractions.
Worked numerical examples and edge cases
Numbers make this concrete. Here’s how the formula plays out across three common scenarios.
- Single prize, small pool: you hold 5 tickets out of 200. Your odds are 5/200, or 2.5%, which converts to roughly “1 in 40”. No combinatorics needed for a single winner; it’s a straight fraction.
- Multiple prizes, larger pool: you hold 10 tickets out of 1,600, and the operator will draw 40 winning tickets. Plugging those figures into the hypergeometric formula gives a probability of roughly 0.2242, or about 22.4% of winning at least one prize. That’s noticeably higher than the naive shortcut of multiplying tickets by prize count and dividing by pool size, which would suggest a higher percentage but doesn’t actually represent a valid probability once it overshoots.
- Edge cases: if your tickets make up a large share of N, say you hold 400 of 1,600 tickets, the exact formula and the with-replacement approximation start disagreeing meaningfully. Likewise, when n approaches N, some outcomes become certainties rather than probabilities. Good calculators flag these boundary conditions rather than quietly rounding them away.
Is a raffle worth the ticket price? The expected value test
Expected value tells you whether a raffle is mathematically worth entering over the long run. The formula is straightforward:
EV = (prize value × probability of winning) − total ticket cost
- A positive EV means the raffle theoretically pays you back more than you spend, on average, across many repeated entries.
- A negative EV, which describes most charity and operator raffles, means you’re paying for the experience and the cause, not the expected return.
- Break-even EV (exactly zero) is rare and usually only appears in small, low-overhead draws.
Statistic in focus: the worked example above showing a 22.4% win probability illustrates the point well. If those 10 tickets cost £20 and the prize is worth £150, EV = (£150 × 0.2242) − £20 = £13.63, a rare case where the maths favours the buyer. Most raffles don’t offer that ratio. Remember EV describes an average outcome over many repeated plays, not a promise for your one entry.
Common calculation mistakes and practical tips
The most frequent error is treating n × k/N, the expected number of wins, as if it were a probability. It isn’t. This shortcut is a useful average count across many prizes, but once it exceeds 1, it clearly cannot represent a probability, and even below 1, it overstates your actual chance of winning at least once once prize numbers climb.
Two other traps catch people out regularly:
- Not confirming whether the draw happens with or without replacement, which changes which formula applies.
- Estimating total tickets sold rather than using the confirmed figure, since a guess that’s off by a few hundred tickets can shift your odds substantially.
Pro Tip: Set a fixed monthly spending cap before you start browsing raffles, and compare the value ratio (prize value divided by ticket price, weighted by odds) across draws rather than judging each one in isolation.
How to reproduce raffle odds in Excel or Google Sheets
You don’t need dedicated software for simple cases. Three formulas cover most scenarios:
- For a single prize, one cell does the job:
=your_tickets/total_tickets. - For multiple prizes without replacement, calculate P(no win) first using
COMBIN(N-k,n)/COMBIN(N,n), then subtract from 1. - In Google Sheets or Excel, that final formula looks like
=1-COMBIN(N-k,n)/COMBIN(N,n), returning your probability of winning at least one table game directly.
Why live totals matter: how Raffle Genius uses real-time tracking to refine odds
Ticket totals rarely stay fixed while a raffle is still open. Sales continue, N keeps rising, and a probability calculated on day one can look badly out of date by the closing deadline. Static estimates mislead readers into thinking their odds are better than they actually are.
Raffle Genius refreshes odds every 10 minutes and ranks draws by value ratio, surfacing undersold raffles where demand hasn’t caught up with the prize on offer. Checking live totals, or setting an alert for a draw you’re watching, beats relying on a number that was accurate only when you first saw it.
Quick rules of thumb for entering raffles
Cap what you spend before you browse, favour a positive value ratio over a big prize photo, and never chase losses by buying more tickets to “catch up”. These three habits do more for your outcomes than any formula. For deeper guidance, BeGambleAware offers tools for keeping play in check, and Rafflegenius’s blog covers odds-reading in more depth.
— matt
Track live odds before you spend another penny
Knowing the formula is one thing; knowing which raffle actually offers decent value right now is another. Rafflegenius closes that gap by refreshing odds every 10 minutes across tracked UK operators, so the numbers you see reflect current ticket sales, not last week’s estimate.

Rather than running the hypergeometric formula by hand for every draw you’re considering, browse the undersold competitions list to find raffles where the value ratio currently favours entrants, or check operators we track for reviewed sites with transparent odds. If you’d rather earn entries without spending, the Play to Win feature lets you collect tickets through free games. Head to the Rafflegenius homepage to compare current draws by odds and prize value before you buy.
Sources
- Raffle Odds Calculator: Chance of Winning With Multiple Tickets | AgentCalc
- Chances Of Winning Calculator - Raffle, Lottery & Tries - Calculator Academy
- Probability of winning a prize in a raffle — Math StackExchange (worked example)
- BeGambleAware
Recommended
18+ · Please gamble responsibly. Raffle Genius is a comparison service and does not run competitions.
Best odds, straight to your inbox
One email a week with the undersold UK competitions closing soon. No spam, unsubscribe any time. 18+